Sorting and plotting cities
Quicksort and structured city data in Python.
Reading structured records
The program reads comma-separated city records into City objects, keeping each city’s name, population, and coordinates together. It writes several versions of the list so the sort order can be inspected outside the graphics window.
One sort, several comparisons
The quicksort implementation accepts a comparison function. I used it to order city names alphabetically, populations from largest to smallest, and latitudes from south to north. Passing the comparison into the sort avoids writing a separate algorithm for each field.
Plotting the result
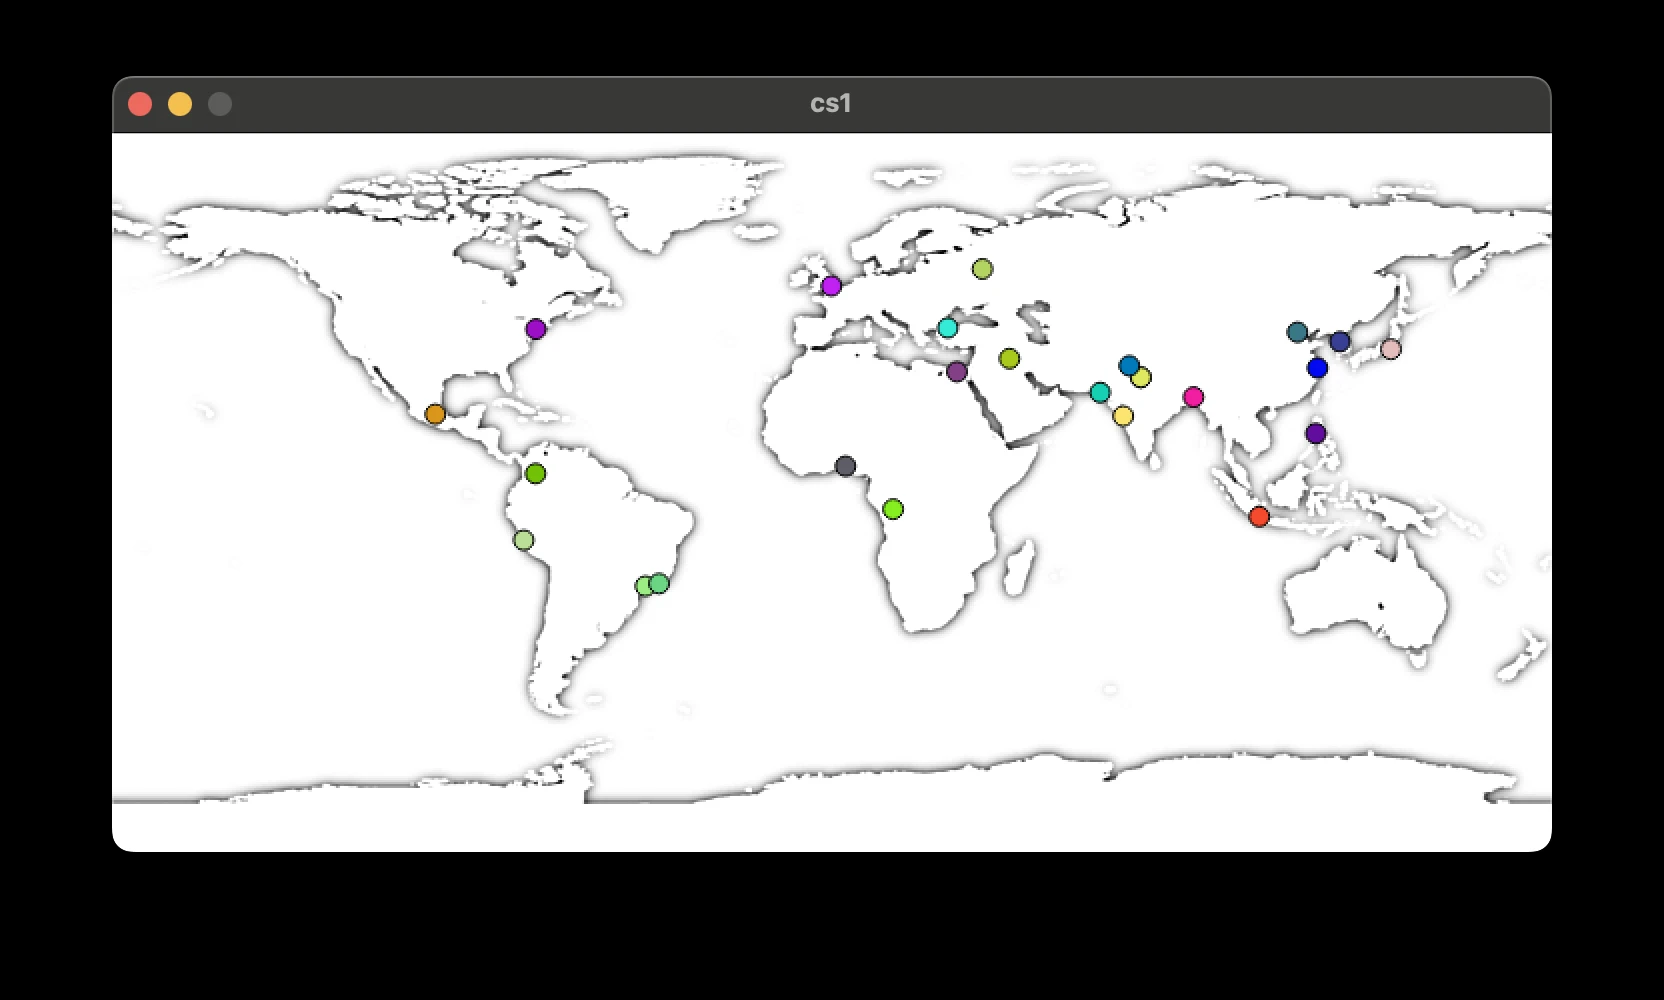
After sorting by population, the graphics loop draws the first 25 cities on a world map. Latitude and longitude determine marker positions. The output connects a data-processing step to something that can be checked visually.