The Daily Graphs
A daily question you answer by placing yourself on a two-axis graph.
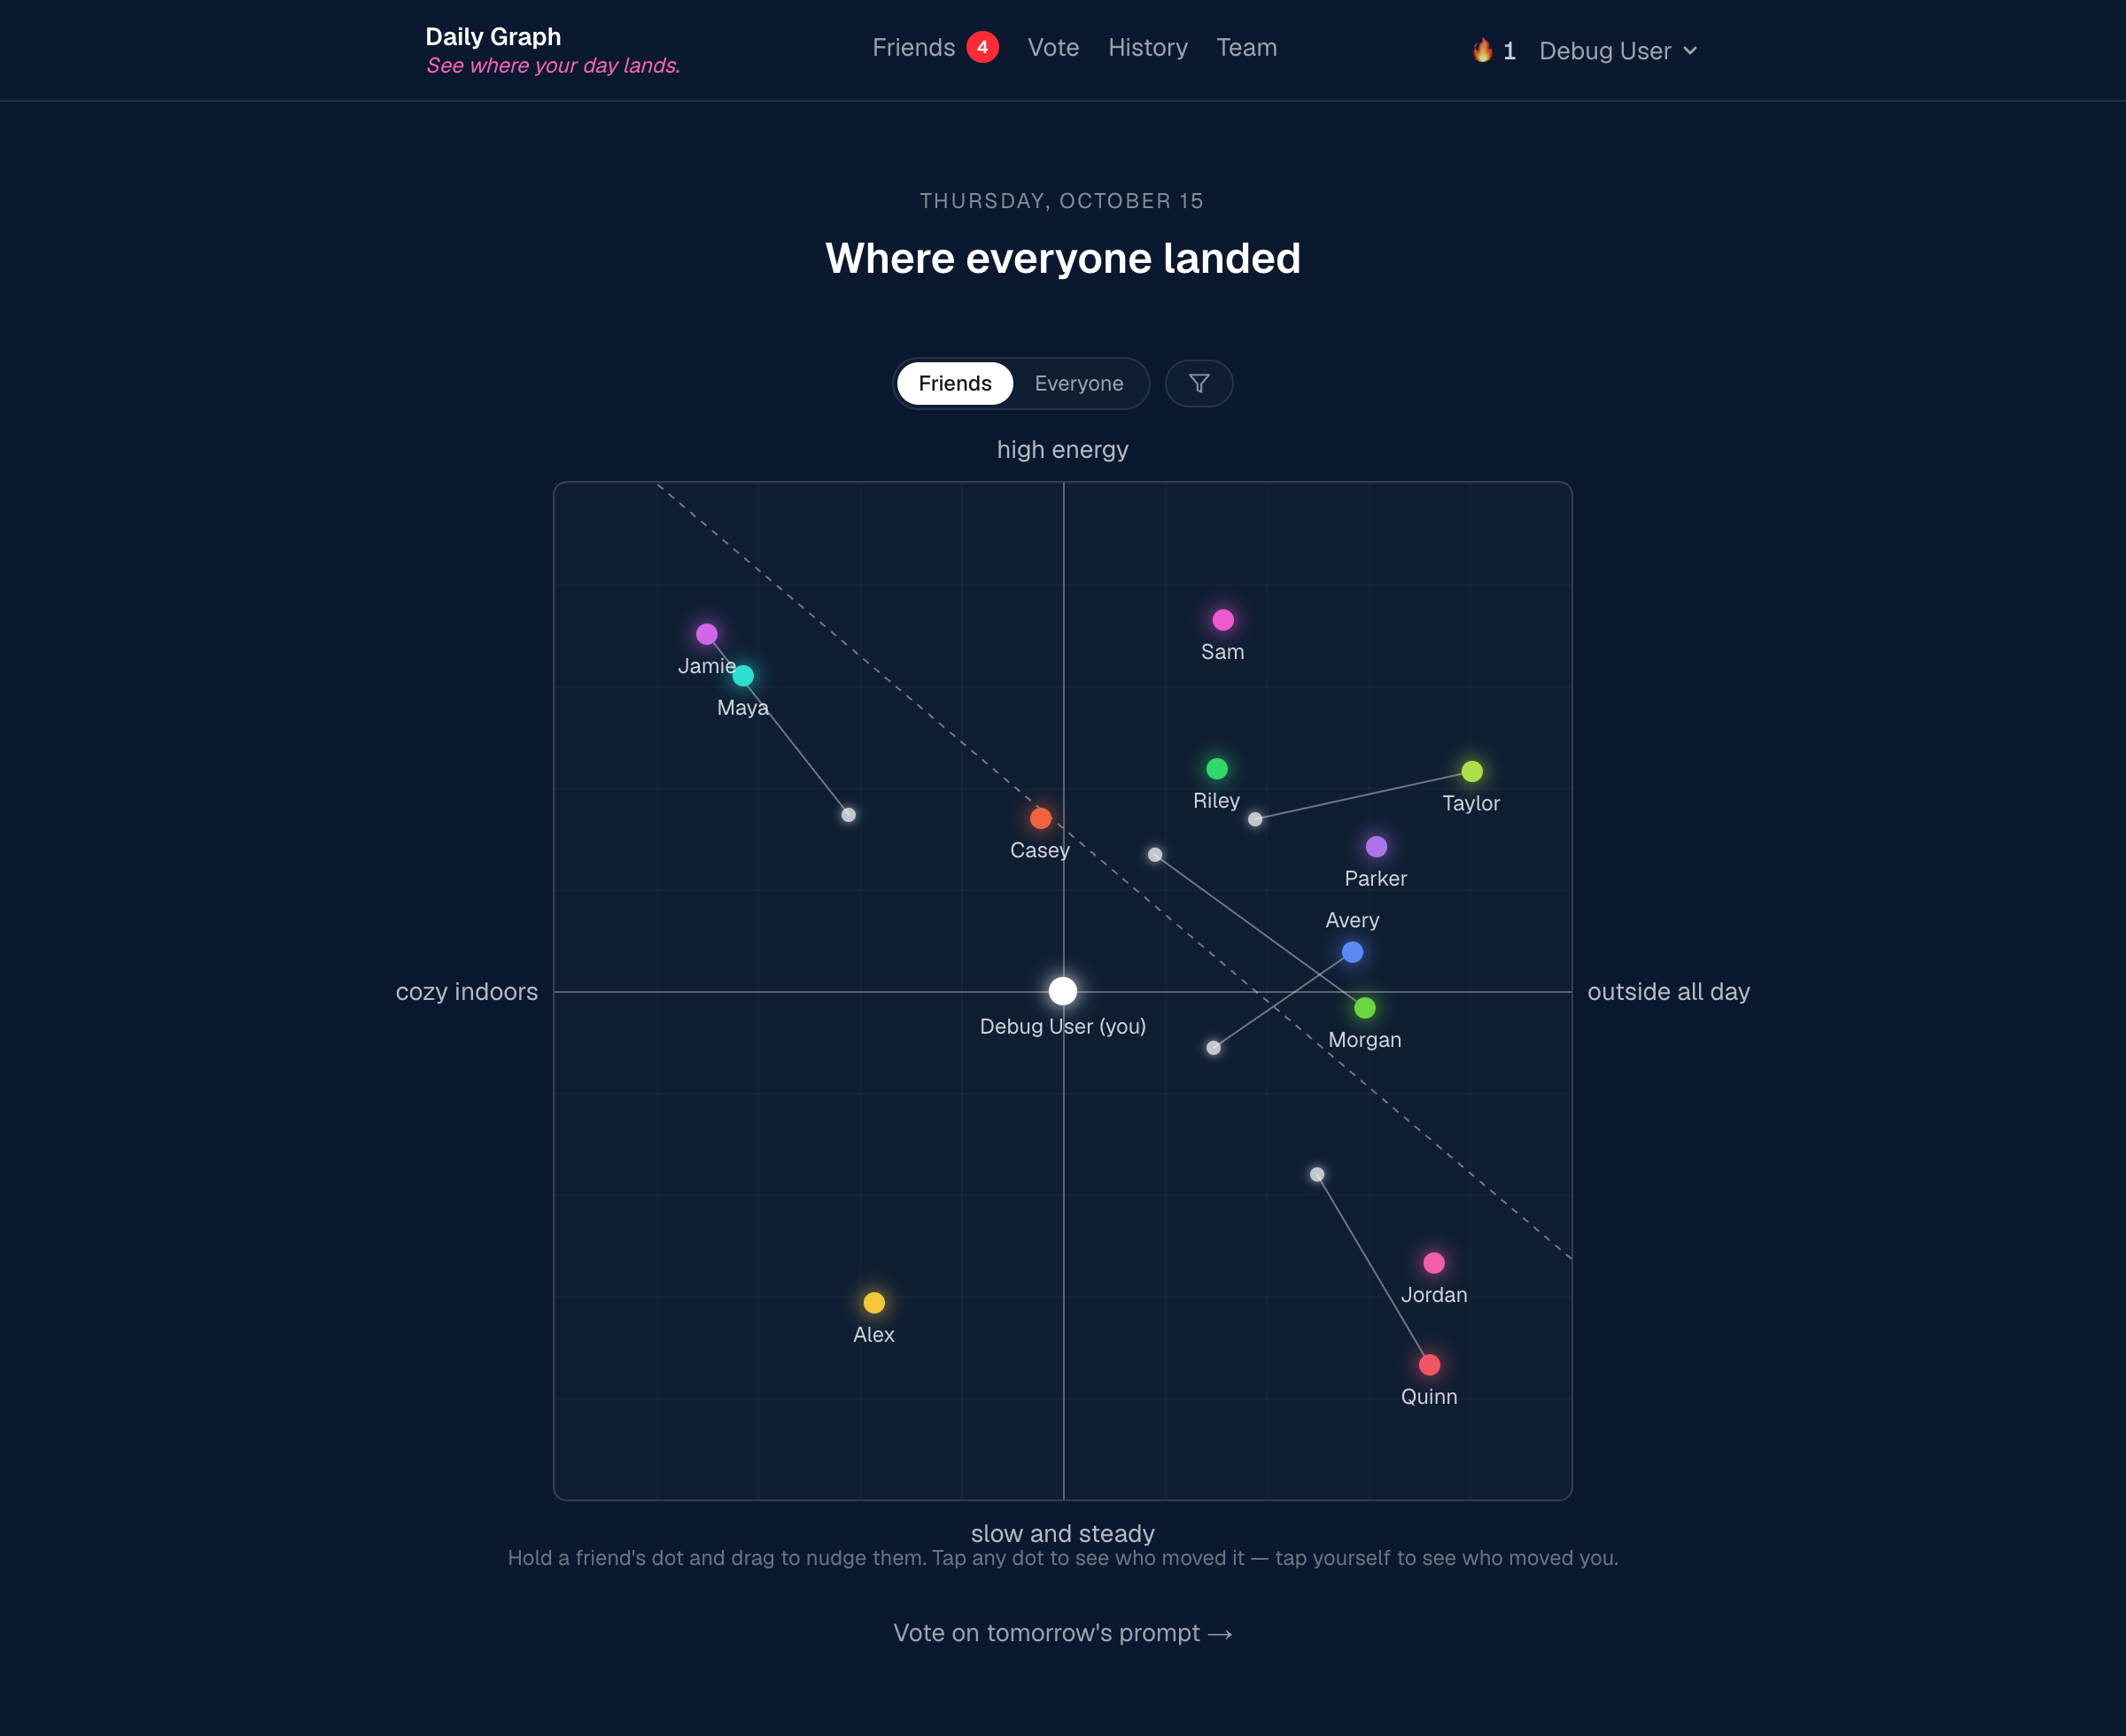
One question each day
The Daily Graphs asks people to place themselves between two pairs of labels. After placing a dot, they can see their friends’ answers and nudge a friend’s position. The graph gives a small daily question a shared visual answer.
Placing and moving dots
A placement has to feel immediate while staying consistent with the server. The app keeps graph data by day, validates coordinates, and stores placements and votes in Redis. Friend connections determine which individual placements a viewer can see; the community view aggregates responses.
Choosing tomorrow’s question
People can suggest the four axis labels and vote on the next prompt. That creates a second daily interaction after placing on the current graph. The mobile layout keeps the same suggestion form and voting controls within a narrow screen.
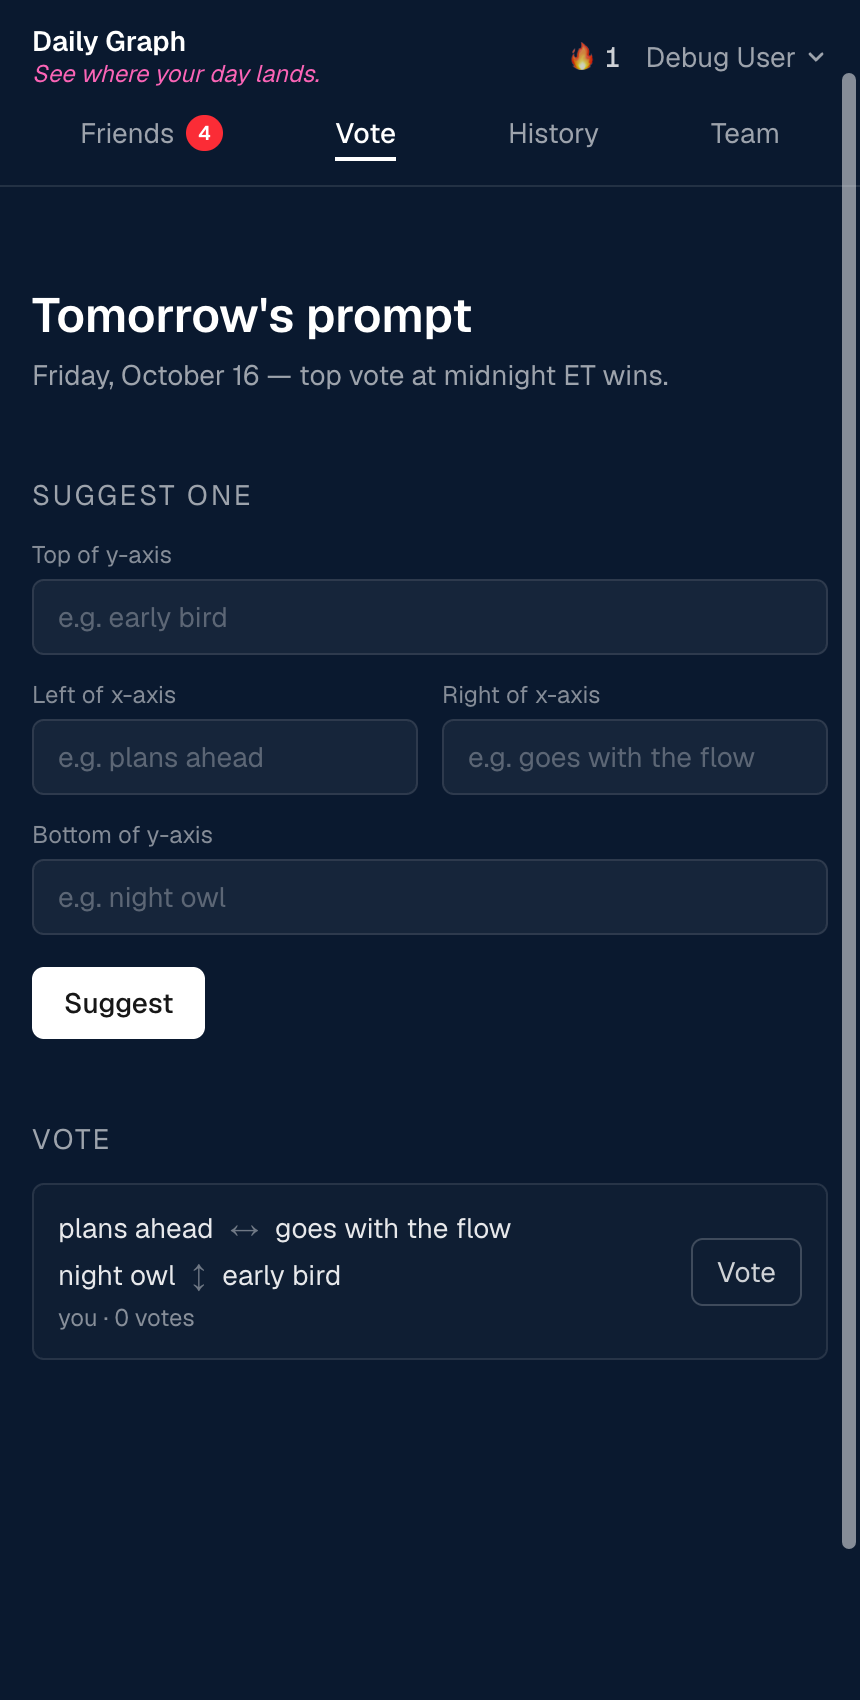
Web and iOS
The web app uses Next.js, React, and TypeScript. A Capacitor shell packages it for iOS, with native push-notification support. Signed HTTP-only sessions, server-side validation, and day-specific records support the social features. The screenshots show demonstration data, not a count of active users.